What APM excels at—and where it stops
APM and infrastructure monitoring shine when requests hit your services, instrumentation runs, and you need to debug latency, errors, and dependencies. They are essential for understanding why a path is slow or which span failed.
In practice, APM is strongest at how your systems behave when traffic exists and when instrumentation runs inside the paths you instrument.
Typical gaps—signal you do not get for free from traces alone:
- No traffic, weak signal — If nobody calls an endpoint or traffic is sparse, you may not know an API is down until someone complains—or until a batch job fails later.
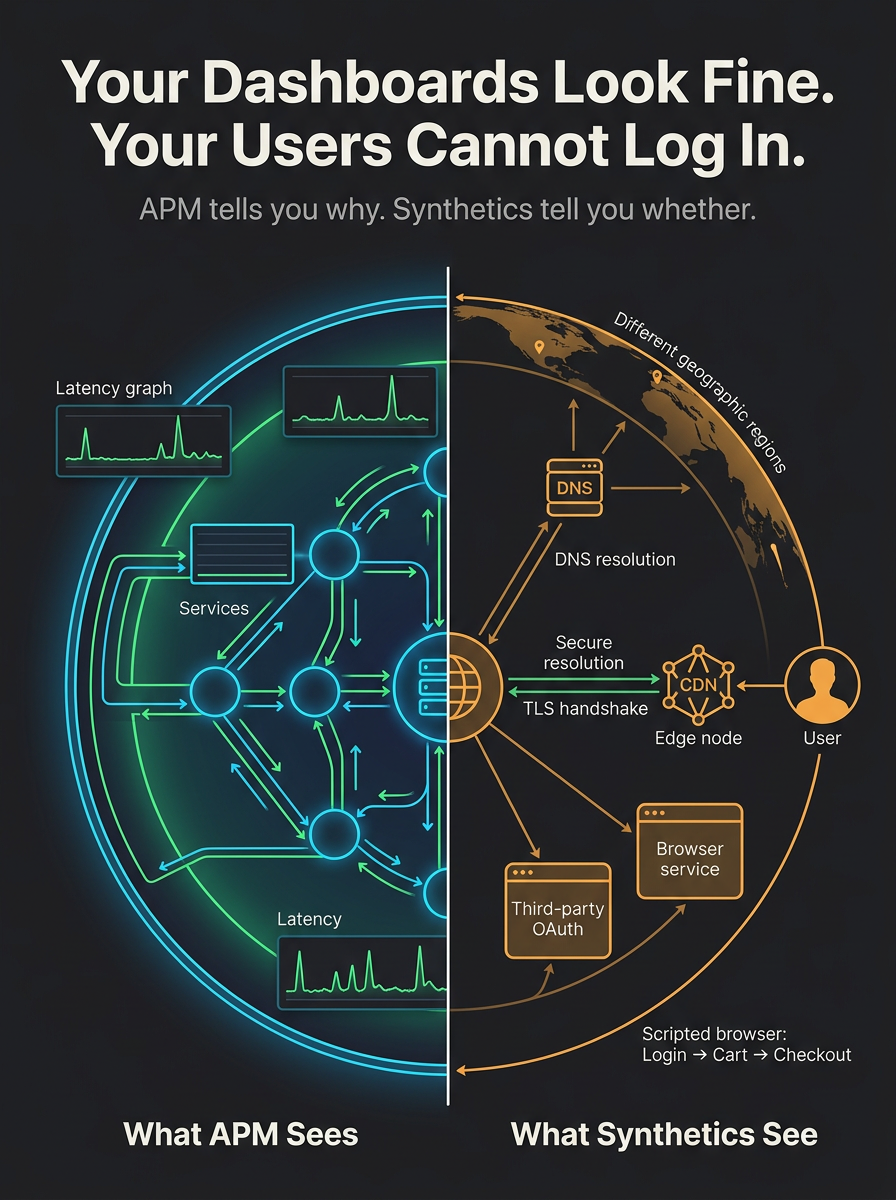
- Blind spots outside your stack — DNS, TLS certificates, CDN edges, WAF rules, geo routing, and third-party OAuth or payment flows can fail before your services show a clear error spike.
- Journey vs. service health — Traces may show each microservice healthy while the composed journey (login → cart → checkout) fails due to contracts, feature flags, or client-side glue.
- SLA and customer perspective — Internal SLOs on latency and error rates are necessary but not sufficient; availability from multiple regions and documented synthetic journeys is easier to align with contracts and customer-facing commitments.
What synthetic and uptime monitoring adds
Synthetic monitors (active checks) run scripted probes on a schedule from chosen locations: HTTP(S), multi-step flows, API sequences. Uptime monitoring is the thin end of the same wedge: is this endpoint reachable and correct, repeatedly?
Together they give an outside-in view—closer to what a client or user experiences—including geography you choose, third-party paths, and signal even when organic traffic is quiet. That complements APM, which is strongest at explaining behavior when traffic and instrumentation produce data.
At a glance: APM vs. synthetic / uptime
The two approaches overlap in spirit but optimize for different questions. This is not a scorecard—both belong in a mature stack.
| Dimension | Typical APM focus | Synthetic / uptime focus |
|---|---|---|
| Perspective | Inside the app and infrastructure you instrument. | Outside-in—like a user or API client hitting your edge and dependencies. |
| Trigger | Real usage produces traces, metrics, and logs. | Scheduled checks (e.g. every minute) you configure—signal even when traffic is quiet. |
| Geography | Often tied to where your services and collectors run. | Chosen regions / POPs—probe from where customers are. |
| What gets proven | Service and dependency behavior under load; deep causality when data exists. | End-to-end path including DNS, TLS, CDN, and third parties along the route. |
Concrete reasons teams still run synthetics
- Detect outages early — Probes from multiple regions can surface DNS mistakes, bad deploys, or edge issues before support tickets spike.
- Validate critical paths — Login → dashboard → key API exercises glue between services, cookies, and CDNs; traces see fragments, synthetics see the journey.
- Third-party and shared fate — When a vendor degrades, your traces may show timeouts at your boundary; end-to-end or vendor-aware checks make dependency pain visible in one operational story.
- Certificates and DNS — Expiring certs and routing drift are classic "dashboards look fine" failures; cheap TLS and availability checks catch them early.
- Change validation — A synthetic suite is a smoke test that never stops, complementing CI and staging.
- SLAs and incident communication — Historical uptime and regional probe results are straightforward to explain: "From our checks in US-East and EU-West, checkout succeeded 99.95% this quarter"—useful next to internal SLO dashboards.
Complement, not duplicate
Duplication happens when you only replay the same internal metric with a ping. Good synthetic coverage is scenario-based and externally routed—aligned to user journeys and SLOs—not a second copy of every service chart. APM answers "why is this request slow?" Synthetics answer "is the critical path up from where it matters, on a schedule we control?"
When teams lean harder on APM alone
Very small surfaces with steady organic traffic, strong real-user monitoring (RUM), and solid integration tests can shift the balance toward traces and session data. Even then, basic uptime and often one or two critical synthetics stay a low-cost backstop for DNS, TLS, and "is the experience actually reachable?"
Bottom line
Tools such as Grafana, Datadog, and New Relic tell you how instrumented systems behave under real load. Uptime and synthetic monitoring tell you whether the experience you promise— from the right places, on a schedule—still holds. Use telemetry for depth; use synthetics for proactive, outside-in assurance. One does not replace the other.
Where Exemplar SRE fits
Exemplar SRE is built around a unified reliability layer: synthetic checks, uptime monitoring, heartbeats, SSL expiry, and deep stack visibility so you catch issues before users do—alongside incident workflows, status boards, and on-call routing. We do not replace your APM; we pair outside-in assurance with the triage and communication path when something breaks.
Probes and synthetics
Scheduled checks across endpoints and paths—not only when real traffic happens to hit a route.
Endpoint, SSL, and availability
HTTP(S) monitoring, certificate tracking, and ping-style signal for the kinds of failures APM may not spell out clearly.
Third-party monitors
Aggregate public vendor status—including providers you also use for observability—next to your own checks, so external outages sit in one operational view.
If you already live in Grafana, Datadog, or New Relic for traces and dashboards, Exemplar closes the loop on proactive availability, customer-visible health, and incident response—without asking you to rip out existing telemetry investments.
Editorial—general discussion only; not vendor-specific guidance.